
High Yield Property Investment UK: How to Read the Number Properly
A yield figure on its own tells you almost nothing.
The UK average gross rental yield in early 2026 sits at roughly 4.5%, with anything above 5% generally treated as strong and anything above 6% as high (📊 source: Zoopla market data via Money Meister, February 2026). At the same time, certain northern cities are producing HMO gross yields of 8–11% (📊 source: FD Commercial market analysis, April 2026), and some operators are advertising arrangements with even higher headline numbers. The spread is wide enough that the same phrase — “high yield property investment UK” — can describe genuinely strong income-producing assets or genuinely weak ones masquerading as high-yielding through location risk, stock quality risk, or sleight of hand on the calculation itself.
This article is a framework for reading the number properly. It defines what yield should mean structurally, sets out where stronger UK yields legitimately come from, names the situations where high headline yields are signals to slow down rather than commit, and provides the questions a serious investor uses to test whether a yield claim is real income or marketing arithmetic.
What yield actually measures — and what it hides
Rental yield is the annual rental income from a property expressed as a percentage of the property’s value or purchase price. Calculation is simple. The interpretation is where it gets interesting, because yield has two forms that are usually treated as interchangeable when they shouldn’t be.
Gross yield. Annual rent divided by purchase price. Ignores all costs. Most commonly quoted in marketing material and headline statistics because it’s the highest number you can put on the page.
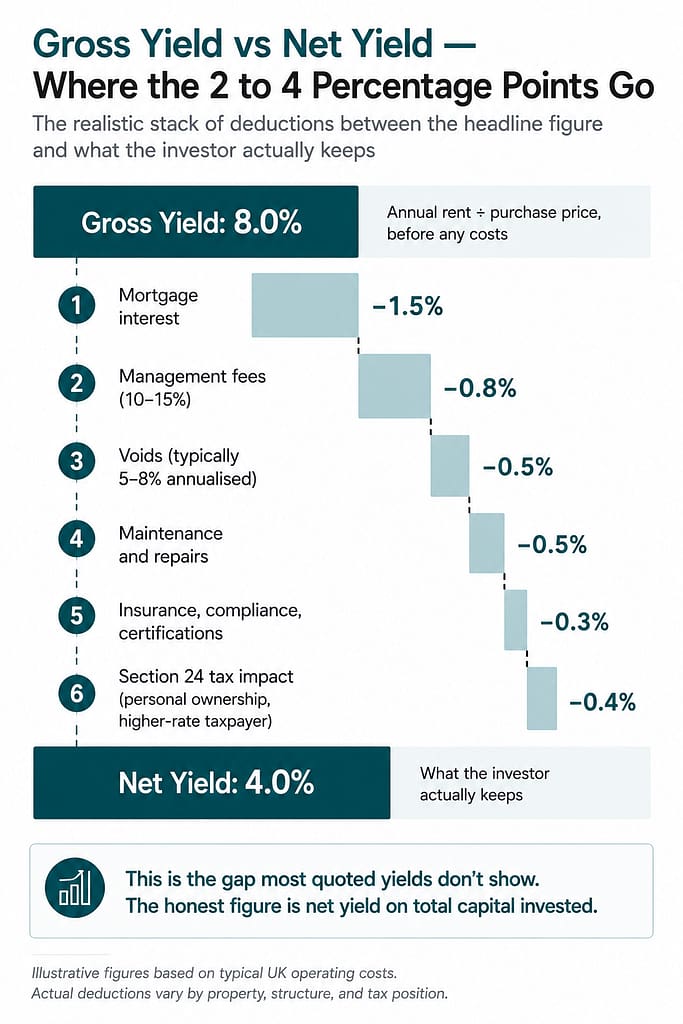
Net yield. Annual rent minus all operating costs — mortgage interest, management fees, voids, maintenance, insurance, compliance costs, Section 24 tax treatment — divided by purchase price (or total capital invested). Typically 2–4 percentage points lower than gross yield (📊 source: The HMO Mortgage Broker market data, March 2026).
The gap between gross and net is where most yield disappointment lives. An 8% gross yield can become a 4–5% net yield after honest costing, and that’s before any voids, refurbishment, or unexpected compliance costs eat into the number further. The most useful framing: gross yield is what the property could earn in theory; net yield is what the investor actually keeps. When operators or marketing material quote yield without specifying which kind, the answer is usually gross.
There’s a second hidden variable beyond gross-versus-net: what the yield is calculated against. Some calculations use purchase price; others use total capital invested (purchase price plus all acquisition costs, refurbishment, fees, finance arrangement costs). The same income against the same property can produce two very different yield figures depending on which denominator is used. The honest figure is yield on total capital invested. The flattering figure is yield on purchase price alone.
What good UK rental yields actually look like in 2026
For context against what genuinely high yield looks like in the UK in 2026:
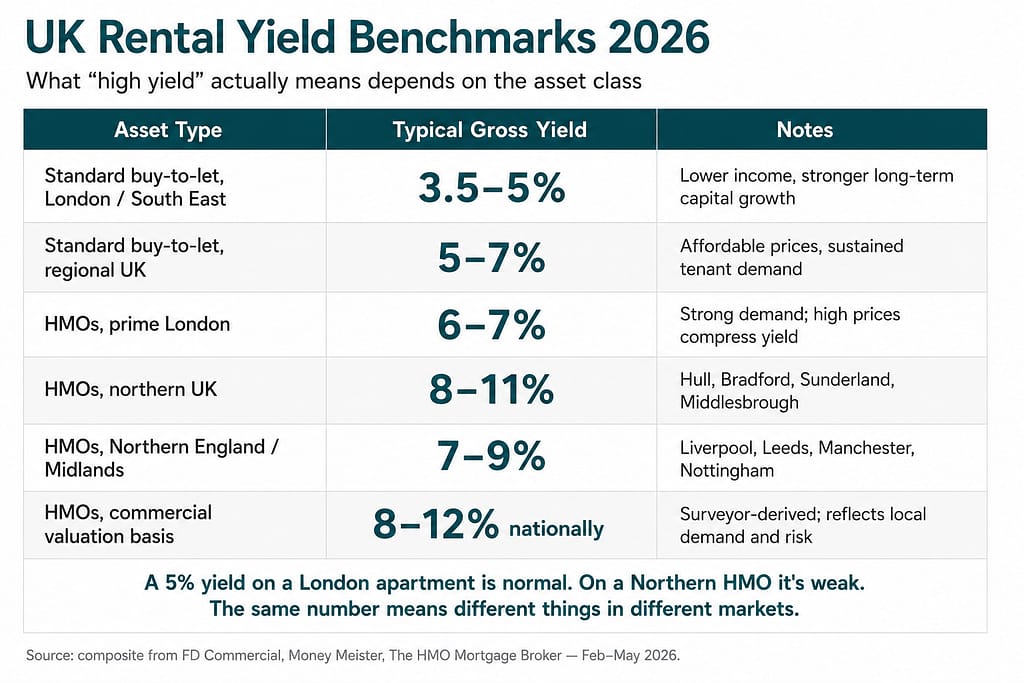
| Asset type | Typical gross yield | Where the strongest numbers sit | |—|—|—| | Standard buy-to-let, London / South East | 3.5–5% | Strong long-term capital growth, lower income | | Standard buy-to-let, regional UK | 5–7% | Affordable purchase prices, sustained tenant demand | | HMOs, prime London | 6–7% | Strong demand, high purchase prices compress yield | | HMOs, northern UK | 8–11% | Hull, Bradford, Sunderland, Middlesbrough — strongest by gross yield | | HMOs, Northern England / Midlands | 7–9% | Liverpool, Leeds, Manchester, Nottingham | | HMOs, commercial valuation basis | 8–12% nationally | Surveyor-derived yield; reflects local investor demand and risk profile |
📊 Source: composite from FD Commercial, Money Meister, The HMO Mortgage Broker (Feb–May 2026)
Two things to take from that table.
First, what counts as “high” depends entirely on the asset class. A 5% yield on a London apartment is normal; on a Northern HMO it’s weak. Yield benchmarks have to be compared like-for-like, not in aggregate.
Second, the geographical spread isn’t random — it’s compensation for risk. Northern HMO yields are higher because purchase prices are lower relative to rents, but those markets typically come with weaker capital appreciation, more constrained refinance markets, and in some specific towns, structural challenges around tenant demand, employment base, or stock quality. The 9% gross yield in a Northern industrial town might be genuinely high, or it might be a value trap with falling property prices and rising void risk. Yield in isolation can’t tell you which.
Where stronger UK yields legitimately come from
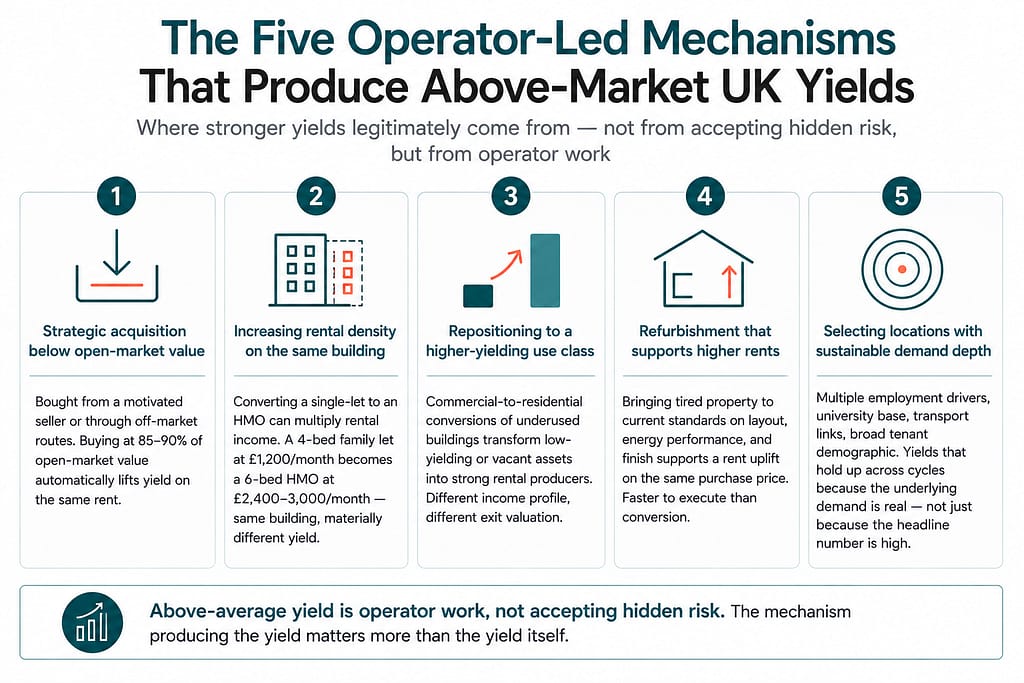
When yield is genuinely above market rate for an asset class and not just appearing high through poor calculation, it usually comes from one or more of five operator-led mechanisms.
Strategic acquisition at below open-market value. The property was bought from a motivated seller, through an off-market route, or in a situation where the seller’s circumstances forced a discount. Buying at 85–90% of open-market value automatically lifts the yield on the same rent. This is operator-skill territory; it requires sourcing networks and the discipline to walk away when the discount isn’t there.
Increasing rental density on the same building. Converting a single-let to an HMO, or a small HMO to a larger licensed HMO, can multiply rental income on the same property. A 4-bed family let producing £1,200/month becomes a 6-bed HMO producing £2,400–3,000/month — the same building, materially different yield. Article 4 directions in many growth areas have made this harder to do casually, but it remains one of the strongest legitimate yield-creation mechanisms when planning permits.
Repositioning to a higher-yielding use class. Commercial-to-residential conversions, particularly of underused commercial buildings in town centres, can transform a low-yielding or vacant asset into a strong rental producer. The income profile of the completed building is materially different from the asset that was acquired.
Refurbishment that supports higher rents. Bringing a tired property to current standards — energy performance, layout, finish — can support a rent uplift that lifts the yield on the same purchase. Less dramatic than HMO conversion, but more capital-efficient and faster to execute.
Selecting locations with sustainable demand depth rather than headline yield maps. Some of the highest-yielding postcodes in the country are high-yielding because nobody else wants the property. Operators who understand tenant demand depth — multiple employment drivers, university base, transport links, broad tenant demographic — find sustainable yield in places that don’t always show up on the headline hotspot lists. South Wales, the M4 corridor, and parts of the South West fit this profile: not the highest-yielding postcodes on paper, but yields that hold up across cycles because the underlying demand is real.
These mechanisms are operator work. They’re the reason serious operators can produce yields meaningfully above market average without taking on the risks that yield-trap properties carry.
When high headline yields are a signal to slow down
The other side of the equation. Above-average yield figures sometimes reflect genuine operator skill; other times they reflect risk that the headline number hasn’t been adjusted for. Specific patterns worth recognising:
The property is in a town with a single dominant employer. A 9% gross yield supported by demand from one major employer or one university intake is structurally fragile. If that employer downsizes, or the university intake shifts, the yield collapses with it.
The stock is older, cheaper, and maintenance-intensive. Lower purchase price lifts the headline gross yield but also means the property is likely to consume more capital in maintenance, compliance upgrades, and refurbishment between tenancies. Net yield often disappoints accordingly.
The yield is calculated on optimistic assumptions. Full occupancy with no voids, no maintenance, no management fees, no compliance costs. The “yield” in the brochure is a theoretical maximum, not an operating reality.
The exit market is thin. High-yielding assets can be hard to sell at the same valuation when the time comes — exit market depth matters as much as entry yield, and operators rarely lead with this.
The yield depends on planning consent that hasn’t been granted. A “projected” HMO yield based on a conversion that hasn’t yet received planning permission isn’t a yield. It’s an aspiration.
The yield is operator-projected, not operator-evidenced. Past performance on comparable assets is meaningful; future projections on hypothetical performance aren’t.
None of these patterns are automatic deal-breakers, but each is a signal to slow down, ask more questions, and verify against independent evidence rather than the operator’s marketing.
The questions to interrogate any high yield property investment claim
Before committing capital to anything described as high yield property investment UK, the questions that distinguish a real yield claim from a marketed one:
- Is the quoted yield gross or net? If gross, what are the realistic operating costs and what does the net look like?
- Is the yield calculated against purchase price alone or against total capital invested?
- What’s the assumed occupancy rate, and what’s the actual evidence supporting it?
- Is this an evidenced yield from a comparable asset the operator has run, or a projected yield on this specific asset?
- What’s the tenant demand profile in this specific location — single employer, mixed employment base, university dependence, transient population?
- What’s the exit market for this asset class in this location, and at what valuation?
- If the yield depends on planning permission or a conversion, is the planning in place, and what’s the realistic timeline and cost to achieve it?
- What’s the operator’s track record — not on property generally, but on running comparable yield-generating assets through full cycles, including void periods and refurbishment cycles?
- What happens if the yield comes in 1–2 percentage points below projection? Does the investment still work?
If an operator can’t answer these clearly with reference to evidence, the yield claim isn’t ready to underwrite — regardless of how attractive the headline number sounds.
How development-led approaches change the yield conversation
For investors who want yield exposure beyond what standard buy-to-let can deliver in 2026, the development-led route changes the yield maths in a specific way.
A standard buy-to-let acquired at open market price is yield-constrained by the entry valuation. The same rent against a higher purchase price produces a lower yield, and there’s not much an operator can do post-acquisition to change that meaningfully.
A development-led approach changes the entry side of the equation. When a property is acquired below open-market value, converted to a higher-density use, refurbished to current standards, and then either held as a completed asset or refinanced at the post-completion valuation, the operator can create both a development margin on completion AND a stronger yield on the retained asset than open-market acquisition would have allowed.
The combination is what experienced UK developers mean when they talk about creating yield through execution rather than buying yield off-the-shelf. The development phase creates the equity; the completed asset produces the income; refinance at the post-completion valuation either returns capital for redeployment or retains the asset on stronger fundamentals than direct purchase would have provided.
This isn’t a guaranteed route to higher yield — development carries its own risks, and execution can erode the yield advantage if it goes wrong — but it’s the structural reason serious operators can produce above-market yields legitimately. The yield comes from the operator’s work, not from accepting risk the headline number doesn’t disclose.
Who high yield property investment suits
A high yield property investment, properly assessed, suits investors who:
- Want income-producing exposure to UK property beyond what standard buy-to-let yields can offer
- Understand the difference between yield and total return, and are willing to interrogate the underlying maths
- Are comfortable with operator-led routes where execution quality is the dominant variable
- Have the diligence patience to verify yield claims rather than taking them at face value
It’s less suited to investors looking for headline numbers without underlying interrogation, or those drawn to the highest yield on offer without considering the risk profile behind it. Property yield rewards discipline at the assessment stage more than it rewards optimism.
What good operator behaviour looks like
The operators worth backing on yield-led arrangements share consistent behaviours. They quote net yield, not just gross. They specify the calculation basis — yield on purchase price versus total capital invested. They evidence yield claims against comparable assets they’ve run, not against projections. They lead with the mechanism that produces the yield (sourcing discount, conversion, refurbishment, location selection) rather than the headline number. And they’re clear about what could erode the yield and how they manage that.
At Prop Invest UK, we work with investors who want exposure to UK property development as capital partners. Our approach is development-led: we source and execute UK property development projects with investors participating in specific opportunities on a deal-by-deal basis. We’re not offering a yield product on this page. Any specific opportunity is offered only to investors who qualify under the relevant exemptions and have received the full project documentation. The purpose of this article is educational — to help investors read any high yield property investment claim they’re shown, from any operator, with the discipline the category requires.
—
About Prop Invest UK
Prop Invest UK is a property development business working with investors who want exposure to UK property development without taking on operational delivery themselves. Each opportunity is sourced, structured, and delivered by an experienced developer, with investors participating as capital partners on a deal-by-deal basis.
Join the investor list to receive details of future opportunities as they become available, subject to investor qualification and project documentation.
—
This article is for general information purposes only and does not constitute financial advice or an offer to invest. UK property investment involves risk, including the risk of capital loss, and returns are not guaranteed. Past performance is not a reliable indicator of future results. Yield figures referenced in this article are aggregated market data and do not represent any specific investment opportunity. Any specific opportunity is offered only to investors who qualify under the relevant exemptions and who have received the full project documentation. If you are uncertain whether an investment is suitable for your circumstances, you should consult an FCA-authorised financial adviser.
—