
Houses in Multiple Occupation produce some of the highest gross yields available in residential property investment — 8-12% across most of the country in 2026, with the North East reaching 15%+ in some sub-markets and London compressed to 6-8%. Compared to standard buy-to-let at 4-6%, the headline numbers look transformative. Overall, these factors contribute to the attractiveness of HMO investment returns.
But headline gross yields don’t tell the full story. HMOs are more regulated, more management-intensive, more capital-intensive, and more compliance-heavy than standard residential letting. Operating costs typically eat 35-45% of gross rental income. Licensing, Article 4 restrictions, EPC compliance, fire safety, and management overhead all sit on top of the income.
This guide cuts through the marketing to look at how HMOs actually stack up as an investment in 2026. The yield mechanics, the operating cost reality, the regional differentiation, where commercial-to-HMO conversion fits, and the structural question of whether direct HMO ownership or capital partnership in HMO development is the right way to access the returns.
What an HMO actually is — and isn’t
A House in Multiple Occupation is, in plain terms, a residential property rented room-by-room to three or more tenants from two or more separate households. The tenants share kitchen, bathroom, and living facilities; each has their own lockable bedroom.
The legal definition under the Housing Act 2004 has two thresholds:
Standard HMO: 3 or 4 tenants from 2 or more households sharing facilities. Licensing varies by local authority — some councils require additional or selective licensing schemes for properties at this scale, others don’t.
Large HMO (mandatory licensing): 5 or more tenants from 2 or more households sharing facilities. Mandatory HMO licence required from the local authority, regardless of council area.
In market language, HMOs are often referred to by their tenant profile:
- Professional HMOs — let to working adults, typically young professionals in employment
- Student HMOs — let to university students, often during the academic year
- Mixed HMOs — combinations of student and professional tenants
- Social housing HMOs — leased long-term to housing associations or local authority operators (like SERCO), which take on all tenant management and pay the landlord guaranteed rent
- Supported living HMOs — specialist accommodation for vulnerable tenants, typically operated by care providers under specific arrangements
The economic case for HMOs is straightforward: the same physical property generates more rental income when let room-by-room than when let as a single household. The structural case is more nuanced — that additional income comes with additional regulatory burden, operational complexity, and capital intensity.
The 2026 yield reality
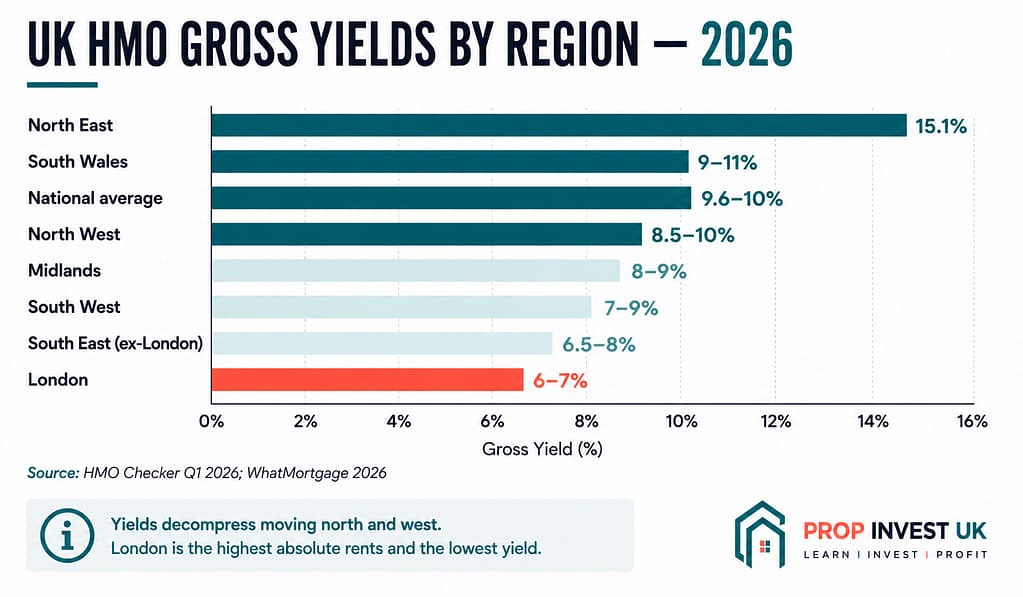
The headline numbers on HMO yields look strong across most of the country.
Average HMO gross yields in 2026 (HMO Checker Q1 2026; WhatMortgage 2026):
- National average: 9.6-10% (slightly compressed from 10.4% in 2025)
- North East: 15.1% (highest yield region)
- North West (Manchester, Liverpool): 8.5-10%
- Midlands (Birmingham, Leeds, Sheffield): 8-9%
- South Wales (Swansea, Cardiff, Newport): 9-11%
- South West: 7-9%
- South East (excluding London): 6.5-8%
- London: 6-7% (highest absolute rents, lowest yield)
Compared to standard buy-to-let at 4-6% across the same regions, the HMO yield premium is substantial — typically 2-5 percentage points higher gross yield for the same property.
A worked example at the property level:
Consider a four-bedroom terraced house in a northern UK city valued at £250,000:
As standard BTL to a family: £1,250-£1,500 per month = £15,000-£18,000 annual gross rent = 6-7.2% gross yield
- As 5-bed HMO (with one bedroom added) at £550 per room: £2,750 per month = £33,000 annual gross rent = 13.2% gross yield (before considering the conversion cost)
The mathematical leverage of room-by-room letting is substantial. But the gross yield figure tells you what the asset produces, not what it actually delivers to the investor after costs.
The cost reality — what HMO operating costs actually run
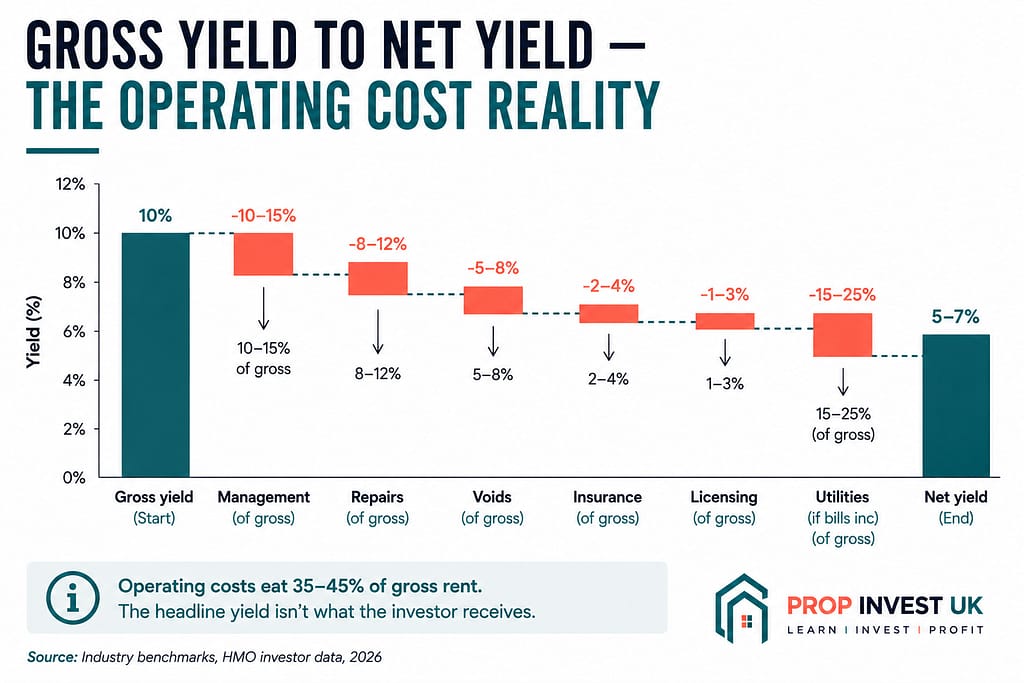
This is where the HMO marketing typically thins out. Operating costs on HMOs are materially higher than on standard buy-to-let, and they erode the yield premium meaningfully.
Typical HMO operating cost percentages (FD Commercial 2026):
| Cost category | % of gross rent |
|---|---|
| Management fees (specialist HMO agent) | 10-15% |
| Repairs and maintenance | 8-12% (higher than standard BTL due to wear) |
| Letting voids allowance | 5-8% |
| Insurance (HMO-specific) | 2-4% |
| Licensing fees (annualised) | 1-3% |
| Utilities (if bills included) | 15-25% |
| Total operating costs | 35-45% of gross rent |
| Resulting net yield | typically 5-7% net (down from 9-12% gross) |
For a bills-included HMO model where the landlord covers utilities, council tax, and internet, operating costs run at the higher end — 45% of gross is normal, sometimes higher.
For a bills-excluded HMO model where tenants pay their own utilities, operating costs run at the lower end — but rents are typically lower to reflect the tenant’s higher cost burden, so net yield ends up in a similar range.
The net yield after costs of 5-7% is still attractive relative to standard buy-to-let net yields of 3-4%, but it’s not the 10%+ figure that gross yield marketing implies. Anyone evaluating HMO investment on gross yield alone is mis-calibrating the actual economics.
The capital cost of running an HMO compliantly in 2026
Beyond ongoing operating costs, HMO investment carries higher capital costs than standard buy-to-let. Five categories matter most.
Capital cost 1: Initial conversion or refurbishment
Converting a standard single-let into a compliant HMO typically requires meaningful refurbishment. Adding bedrooms or en-suites. Upgrading fire safety (fire doors throughout, mains-wired smoke and heat detection, emergency lighting in some cases). Installing kitchens that meet HMO standards. Bringing the property up to current building regulations.
A typical four-bed to six-bed HMO conversion costs £40,000-£80,000 depending on the building’s starting condition and the specification target. The Gore Terrace conversion documented in our case study ran £300,000 in build cost for a 14-bedroom HMO — illustrative of the scale at the upper end of HMO development.
Capital cost 2: HMO licensing
Mandatory HMO licences (for properties let to 5+ tenants from 2+ households) cost £600-£1,500 per property in most local authorities. Additional or selective licensing schemes operated by some councils add further cost.
Licences are typically valid for 3-5 years, with renewal costs at the end of each cycle. Across a ten-year hold, total licensing costs can run £2,000-£6,000 per property.
Capital cost 3: EPC C compliance by October 2030
Most existing HMO stock — particularly conversions of Victorian and Edwardian properties — currently sits at EPC D or E. The 2030 EPC C requirement means substantial energy efficiency investment is needed.
For typical HMO properties, EPC C compliance work runs £6,000-£10,000+ per property under the £10,000 cost cap. We covered the broader EPC C regulatory context in our BTL vs C2R article.
Capital cost 4: Mortgage-specific costs
HMO mortgages are specialist products. Most high-street banks don’t offer them. Typical features:
- Higher deposit requirements: 25-35% minimum (compared to 20-25% for standard BTL)
- Higher interest rates: 0.1-0.5% above standard BTL rates
- Higher arrangement fees: typically 1.5-2.5% of facility
- More complex underwriting: lenders scrutinise location, tenant profile, licensing, refurbishment scope
For a £250,000 HMO acquisition with 30% deposit, the upfront cost runs £85,000-£95,000 (deposit + SDLT + legal + arrangement fees + initial refurbishment contingency) — materially higher than a comparable standard BTL acquisition.
Capital cost 5: Furniture and fit-out
HMO rooms are typically let furnished — beds, wardrobes, desks, basic furnishing. A 6-bed HMO needs £8,000-£15,000 of furniture and fit-out, with ongoing replacement costs as items wear.
The combined effect of these capital costs: HMO investment requires materially more capital deployment per property than standard BTL — typically £100,000-£150,000+ to enter at the property level, plus ongoing capital expenditure to maintain compliance and condition.
Where HMO investment actually fits in 2026
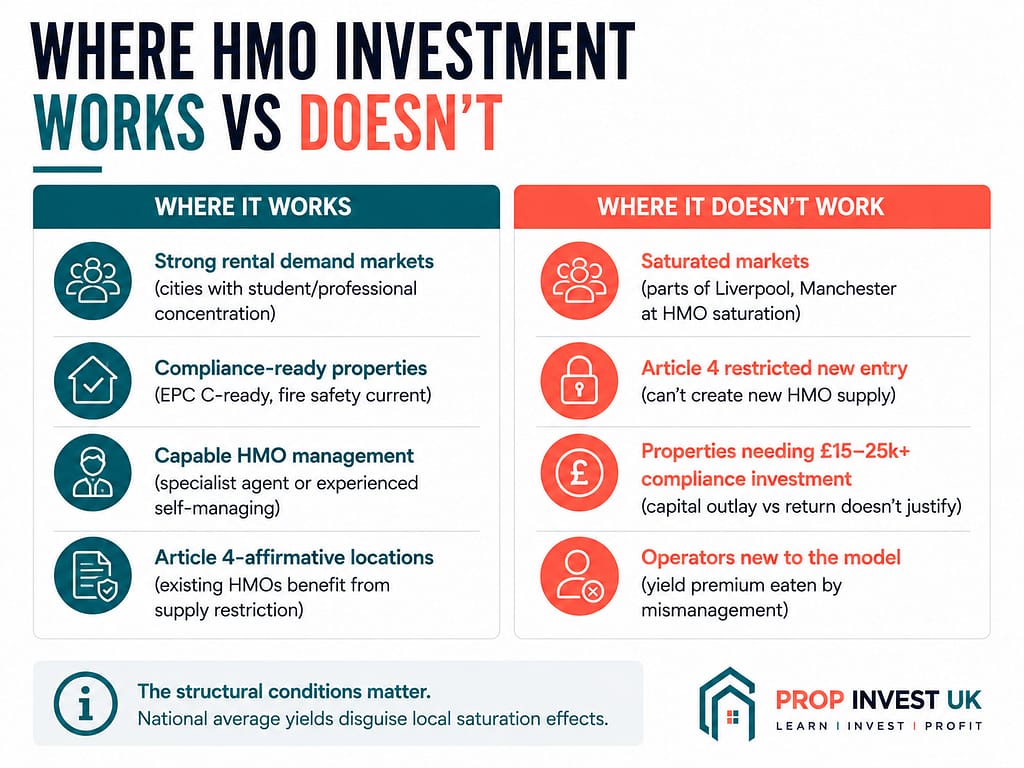
The structural HMO picture in 2026 produces a clear set of conditions under which HMO investment works well — and conditions under which it doesn’t.
Where it works
Strong rental demand markets: Cities with substantial student populations (Manchester, Liverpool, Leeds, Sheffield, Birmingham, Cardiff, Swansea, Newcastle, Edinburgh). Cities with strong professional rental demand (similar list, plus the largest regional employment centres). Locations where the demographic of tenants HMOs target — students, young professionals, key workers — is genuinely concentrated.
Compliance-ready properties: HMOs that already meet EPC C requirements, fire safety standards, and any local additional licensing requirements. The compliance burden is real, and properties that already satisfy it avoid the cost of bringing them up to standard.
Capable management: Professional HMO agents or experienced self-managing landlords. The management complexity of HMO operation isn’t optional — it’s structural. Trying to manage HMOs the same way as standard BTL produces poor outcomes for both tenant satisfaction and landlord economics.
Article 4-affirmative locations: Areas where HMO conversion is permitted under current planning rules, or where existing HMOs benefit from the supply restriction that Article 4 provides. The Article 4 framework we covered in our Article 4 article creates the supply-constrained dynamic that supports HMO yields in many markets.
Where it doesn’t work
Saturated markets: Areas where HMO conversion has accelerated faster than tenant demand. Some parts of Liverpool and Manchester have reached saturation in particular postcodes, leading to compressed yields and longer void periods. National averages disguise local saturation effects.
Article 4 restricted areas where new HMO conversion isn’t permitted: For existing HMOs, this is supply restriction (positive for yield). For new entry, it’s prohibitive — you can’t easily create the asset.
Properties requiring substantial compliance investment: HMOs that need £15,000-£25,000+ of EPC, fire safety, or refurbishment work to bring up to standard may not produce returns that justify the capital outlay over a reasonable holding period.
Operators new to the model: HMO management is a specialist skill. Operators new to it typically underestimate the management overhead, the tenant turnover, and the maintenance costs. The yield premium gets eaten by mismanagement.
How commercial-to-HMO conversion fits
Throughout our content body, we’ve focused heavily on commercial-to-residential conversion as our operating model. The HMO investment landscape connects directly to this.
The structural case for commercial-to-HMO conversion specifically:
It produces new HMO supply where Article 4 restricts house-to-HMO conversion: As we covered in our Article 4 article, Article 4 designations are typically structured to protect family housing from conversion. Commercial-to-HMO doesn’t trigger this concern — it doesn’t remove family housing because the building wasn’t family housing to begin with.
It creates HMOs at acquisition prices below what comparable house-to-HMO conversion costs: Commercial buildings in Article 4 areas are typically priced for commercial use only, with no residential conversion premium. The forced appreciation through planning gain and conversion, as documented in our forced appreciation article, can produce post-conversion HMO values substantially above the all-in conversion cost.
It allows scale and specification that house-to-HMO conversion can’t: Larger HMO schemes — 14, 18, 26 beds — require larger buildings than typical residential conversion can produce. The Gore Terrace 14-bed HMO and the Mozarts 26-bed HMO illustrate this scale, both delivered through commercial-to-residential conversion routes.
For HMO investors specifically, the commercial-to-HMO route produces assets that the standard buy-and-convert HMO model can’t access — typically larger schemes, in areas where house-to-HMO is blocked, at acquisition prices that reflect commercial rather than residential value.
Direct HMO ownership vs HMO capital partnership
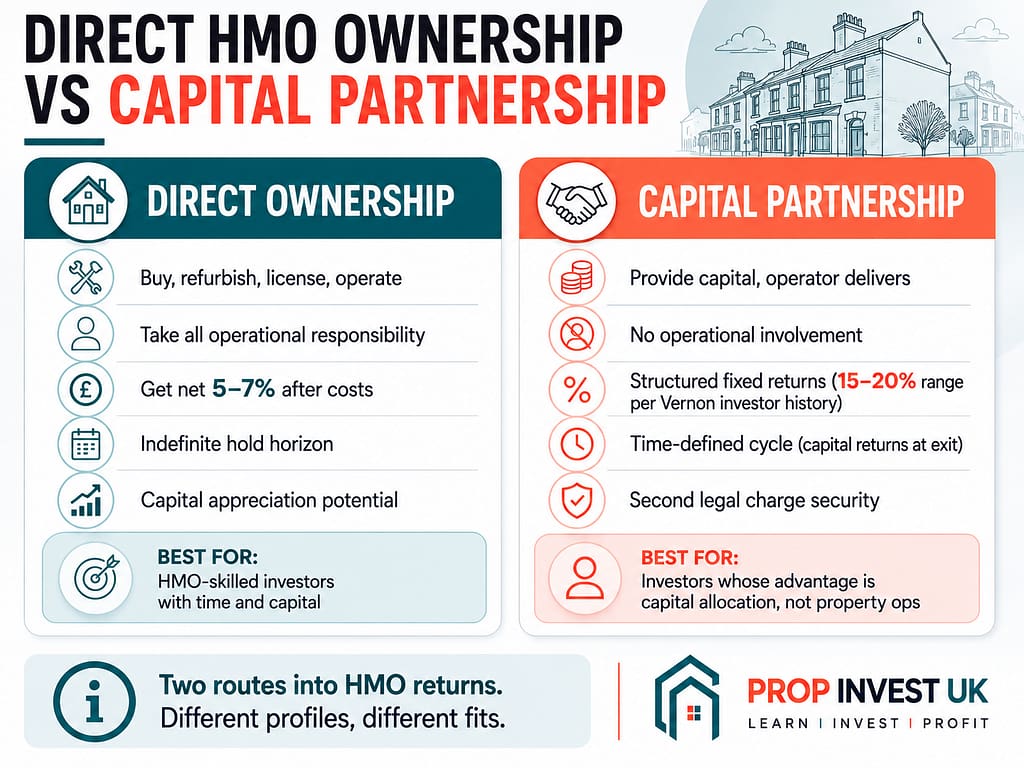
For investors evaluating HMO exposure, two structural routes exist.
Route 1: Direct HMO ownership
The investor buys, refurbishes, licenses, and operates an HMO directly. They are the landlord. They take all the operational responsibility, all the regulatory burden, all the management complexity — and all the returns net of those costs.
For investors with HMO operational expertise, time to manage, capital to deploy, and tolerance for direct landlord activity, this route works. The net yield after costs of 5-7% is attractive, and capital appreciation over a 10+ year hold can be substantial.
For investors without that combination of capability and capacity, direct HMO ownership produces outcomes that are typically below the marketed gross yields. Operating costs eat margin. Management complexity produces friction. Compliance burden accumulates.
Route 2: HMO capital partnership
The investor provides capital to a property development operator who delivers HMO projects — either to retain as rental assets or to refinance onto BTL mortgages with the investor receiving structured returns.
For HMO development specifically, capital partnership returns are typically structured as fixed-return loans in the 15-20% per annum range (as documented in the investor case studies of Raf, Jason, and Glenn), secured by second legal charges against the development property as we covered in our investor security article.
The trade-offs vs direct ownership:
Capital partnership advantages:
- No operational involvement (no management, no compliance, no tenants)
- Structured returns (defined rate, defined term)
- Operator handles all the work
- Lower capital scale required than direct ownership
- Time-defined cycle (capital returns at exit)
- Can be structured through pension wrappers as covered in our pension into property article
Direct ownership advantages:
- Ongoing rental income beyond a single project lifecycle
- Capital appreciation on the held asset over long periods
- Direct control over the property
- Indefinite hold horizon
For investors whose comparative advantage is capital allocation rather than property operations, capital partnership produces better outcomes. For investors who want to be active landlords and have the time and skill, direct ownership produces outcomes that are different in profile but not necessarily worse.
The question isn’t which is universally better — it’s which fits the specific investor’s circumstances. The body of our content is structured around the capital partnership route because that’s what we offer, and the investor profile we serve is typically the one for whom that route is the structural fit.
What the Mozarts and Gore Terrace case studies illustrate
The two flagship HMO conversions documented across our content body show how the HMO investment thesis plays out at scale.
Gore Terrace (full case study): Period Georgian townhouse acquired at £411,000 in March 2023. Converted to 14-bedroom HMO at £300,000 build cost. Total project cost £921,538. Refinanced onto Shawbrook BTL facility at 75.23% LTV against £1,225,000 valuation — covering 100% of project cost. Currently generates approximately £110,000 of annual gross rent, equating to approximately 9% gross yield on the post-refinance valuation.
Mozarts (conversion article): Two adjoining commercial buildings acquired at £625,000 in April 2024. Currently converting to 26-bedroom en-suite HMO with projected GDV of £2,480,000 at completion. Senior debt of £1,100,000 at 61.1% LTGDV from Signature, with £700,000 of combined investor and developer equity capital.
Both projects illustrate the commercial-to-HMO conversion model at meaningful scale. Both demonstrate the forced appreciation that justifies the model — Gore Terrace produced approximately £814,000 of value uplift from the £411,000 acquisition. Both involved capital partners in the structured investor layer (Raf at Gore Terrace, Glenn at Mozarts), receiving fixed returns in the 15-20% range secured by second legal charges.
The case studies aren’t just illustrative — they’re the evidence base for the structural claims about commercial-to-HMO conversion as a viable HMO investment route at scale.
The six questions for any HMO investment opportunity
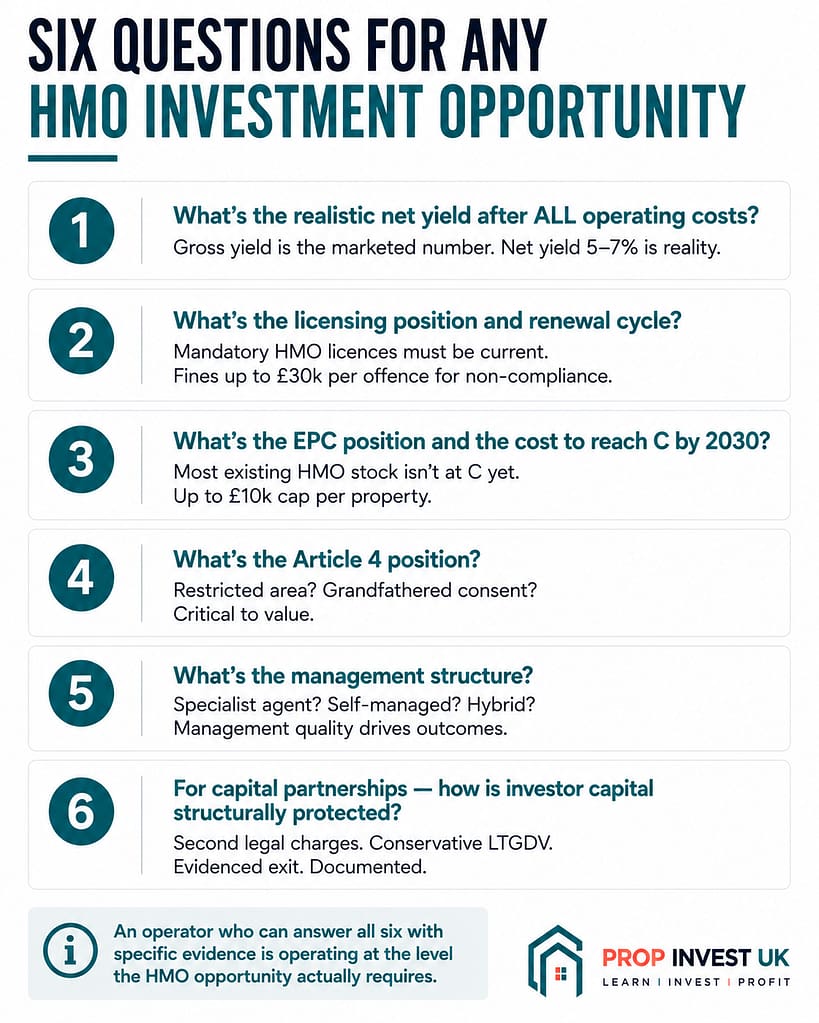
Whether evaluating direct HMO ownership or HMO capital partnership, six questions surface the structural soundness.
1. What’s the realistic net yield after all operating costs?
Gross yield is the marketed number. Net yield after the 35-45% operating cost reality is the actual investor return. Any opportunity that doesn’t disaggregate gross vs net is presenting incomplete information.
2. What’s the licensing position, and what’s the renewal cycle?
Mandatory HMO licences must be current. Additional or selective licensing schemes in the local authority must be satisfied. Renewal timing and costs must be planned. An HMO without proper licensing is operating illegally and faces fines up to £30,000 per offence.
3. What’s the EPC position and the cost to reach C by 2030?
Most existing HMO stock isn’t currently at EPC C. The remediation cost (up to £10,000 per property under the cost cap) needs to be planned for. Investors should know what this cost is for any specific property and whether it’s been accounted for in the model.
4. What’s the Article 4 position?
Is the property in an Article 4 area where new HMO conversion is restricted? Is the existing HMO grandfathered in or recently consented? What does the local authority’s HMO policy look like for the relevant area?
5. What’s the management structure?
Self-managed, professional HMO agent, or hybrid? Management quality determines tenant satisfaction, void rates, and maintenance costs. Operators with documented HMO management track records produce different outcomes from operators new to the model.
6. For capital partnerships specifically — how does the structure protect investor capital?
The structural protections we covered in our investor security article and capital stack article. Second legal charges. Professional documentation. Conservative LTGDV. Evidenced exit strategies.
In summary
Houses in Multiple Occupation can produce gross yields of 8-12% across most UK markets in 2026 — substantially above the 4-6% gross yields available on standard buy-to-let. The premium is real, but it doesn’t translate directly to net yield. Operating costs of 35-45% of gross income (management, voids, maintenance, licensing, insurance, utilities where included) erode the headline numbers to net yields of typically 5-7%.
The structural conditions that make HMO investment work in 2026:
- Strong rental demand markets with concentrated tenant demographics (students, young professionals, key workers)
- Properties already at or close to current compliance standards
- Capable management — professional HMO agent or experienced self-managing landlord
- Locations where regulatory dynamics favour existing or commercial-to-HMO conversion supply
For investors evaluating HMO exposure, two structural routes exist. Direct ownership requires HMO operational expertise, capital scale, and tolerance for active landlord activity. Capital partnership in HMO development — typically through commercial-to-residential conversion routes like those documented at Gore Terrace and Mozarts — provides exposure without operational burden, with structured returns in the 15-20% per annum range secured by second legal charges.
The six questions worth asking about any HMO opportunity:
- What’s the realistic net yield after all operating costs?
- What’s the licensing position and renewal cycle?
- What’s the EPC compliance position to reach C by 2030?
- What’s the Article 4 position?
- What’s the management structure?
- For capital partnerships — how is investor capital structurally protected?
An operator who can answer all six with specific evidence is operating at the level the HMO opportunity actually requires. One who presents gross yield numbers without the cost reality, the compliance burden, or the management structure is selling an incomplete picture.
If you want to evaluate specific Prop Invest UK opportunities — including HMO conversion projects structured for capital partner participation — you can join the investor list. We share specific opportunities with capital partners and provide full structural and operational detail on a per-deal basis.
This article is general information only and is not financial advice. UK property investment carries risk, including the risk of total loss of capital invested. HMO yields, operating costs, regulatory frameworks, and project outcomes vary by location and by operator. Past project outcomes are not indicative of future performance. UK property development capital partnership opportunities are typically not regulated by the Financial Conduct Authority, and investors do not have access to the Financial Ombudsman Service (FOS) or the Financial Services Compensation Scheme (FSCS).