
The UK property investor landscape 2026 looks superficially similar to a decade ago — but the structural mechanics have shifted in fundamental ways. The Bank of England has cut base rates six times since August 2024 (to 3.75%), house prices are growing modestly (+1.2% YoY in February 2026), and mortgage approvals remain reasonable. On the surface, conditions are stable.
But underneath the surface, the model that built UK property wealth over the last thirty years is breaking. Landlords are quietly exiting. Construction starts have just begun to recover from a multi-year slump. Regional markets are outperforming London for the first sustained period in two decades. Capital is moving from passive residential ownership into active development and from generalist allocation into specialist operators.
This guide explains where the investor landscape actually sits in 2026, what’s changed structurally over the last five years, where serious property capital is moving, and how the strategic landscape looks for investors evaluating their next allocation decision.
The 2026 macro picture
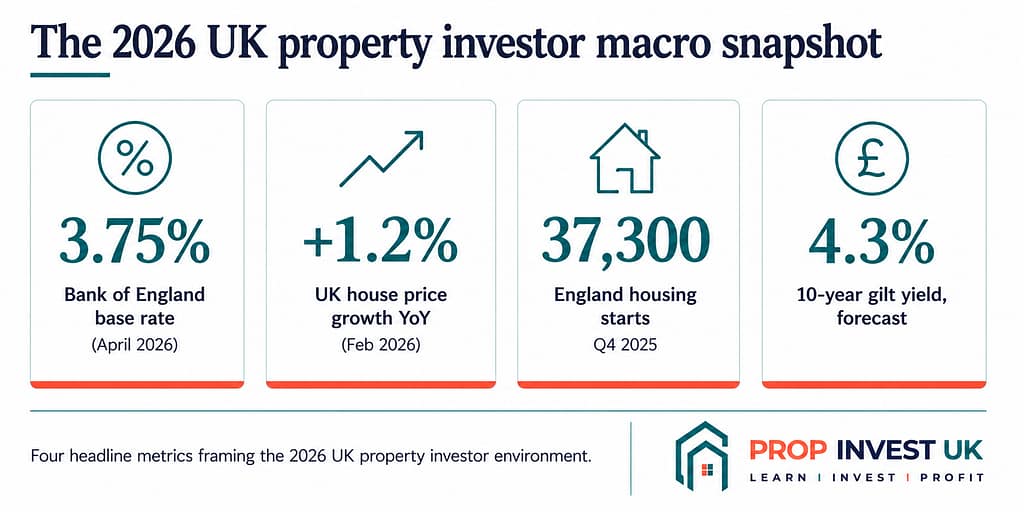
The headline economic context for UK property investors in 2026 sits at the intersection of three factors: an interest rate cycle that has begun easing but remains elevated by historical standards, an inflation profile that has come closer to target but isn’t yet stable, and a geopolitical environment that has reintroduced volatility into expectations for both.
Interest rates and borrowing costs
The Bank of England base rate stood at 3.75% as of April 2026, having been reduced six times from the August 2023 peak of 5.25% (BuyAssociation, 2026). This represents meaningful relief from the peak rate environment, but the rate remains substantially higher than the 0.1%-0.5% range that prevailed for most of the 2010s.
For property borrowers, the practical effect is mixed:
- Development finance has reduced from peak pricing to a current 6.5%-9.5% per annum range for mainstream residential schemes (Construction Capital, 2026), as we covered in our development finance cornerstone
- Bridging finance sits at 0.55%-1.25% per month depending on profile
- Standard buy-to-let mortgages have crept back up since early 2026 due to gilt yield movement, with average two-year fixed deals at approximately 5.67% and five-year deals at 5.69% as of May 2026 (MoneyWeek, 2026)
The implication for property investment: borrowing costs have meaningfully reduced from peak but haven’t returned to pre-2022 levels. The “cheap money” environment that supported leveraged BTL portfolio building through the 2010s is structurally over.
Inflation and rate trajectory
UK inflation has been heading toward the Bank of England’s 2% target through 2025 and 2026, but the trajectory has been disrupted by geopolitical factors — particularly the conflict in Iran beginning in late February 2026, which has pushed up oil prices and inflation expectations.
The consensus view: further rate cuts in 2026 are possible but no longer assumed. Mortgage rates, which had been on a downward trajectory through early 2026, have stabilised or crept upward as gilt yields have adjusted. Ten-year gilt yields are expected to settle around 4.3% per CBRE’s 2026 outlook (CBRE Research, 2026).
The practical implication: investors and operators planning over 18-30 month project horizons should not assume rate reductions will continue mechanically. Conservative project structures (which we covered in our overrun article) become more important when rate trajectory is uncertain.
House prices and regional variation
The headline UK house price story in 2026 is unspectacular: +1.2% year-on-year in February 2026 according to the UK House Price Index, with seasonally adjusted month-on-month growth of 0.6% (House of Commons Library, 2026).
But the regional picture matters more than the national average:
- Northern Ireland, Yorkshire & the Humber, and the North East have seen the strongest growth
- London, the South East, and the South West have seen prices fall
This is the third consecutive year of regional outperformance over London — a sustained pattern that breaks with the 1995-2022 norm where London led the UK market.
The forward-looking forecasts from major property houses lean cautiously positive:
- Savills forecasts +24.5% UK house price growth over 2025-2029 (taking average UK price to ~£336,000)
- JLL projects +19.9% cumulative growth over the same period
- 2026 specifically is forecast at +2.0% (Savills) to +3.5% (JLL)
- Cushman & Wakefield expects sustainable growth driven by softer labour markets but constrained by tax freezes (Cushman & Wakefield, 2026)
The implication: natural appreciation alone produces modest returns over a 2026 investor’s likely holding period. Forced appreciation through development (which we covered in our forced appreciation article) is one of the few mechanisms that can produce substantially higher returns regardless of the natural market trajectory.
The structural shifts that define 2026
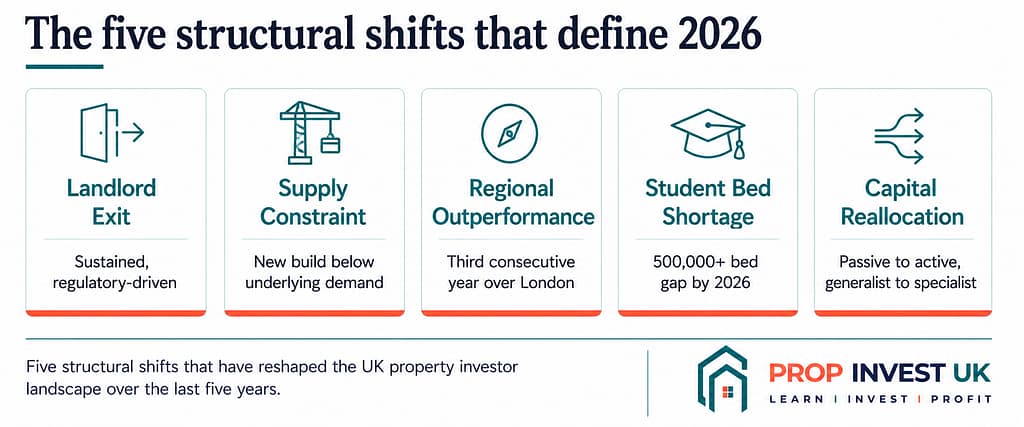
Five structural shifts have reshaped the UK property investor landscape in the last five years. Each is meaningful in isolation. Combined, they explain why the model that worked for thirty years is no longer the right model for 2026 capital allocation.
Shift 1: The landlord exit is real and sustained
Cushman & Wakefield’s 2026 residential forecast is direct: “Increased regulations (recent tax changes, MEES, and the Renters Right Act) are likely to continue to push many private landlords out of the market” (Cushman & Wakefield, 2026).
We covered the structural reasons for this exit in detail in our BTL vs C2R article: Section 24 mortgage interest restrictions, EPC C requirements by October 2030 with £30,000 non-compliance fines, the Renters’ Rights Act removing Section 21 possession, Making Tax Digital quarterly filing requirements, and the 5% SDLT surcharge on additional properties.
The net effect on the rental market: rental supply is shrinking even as rental demand grows. Average UK rents are forecast to increase by approximately 5% in 2026 (dbrinvest, 2026), continuing the rental growth pattern that has run since 2021. This creates higher rental yields for the operators who remain in the market — but the operational complexity makes it a smaller pool of viable participants than in the previous decade.
Shift 2: New build supply is structurally constrained
UK house building starts collapsed in 2024 and have only just begun to recover. There were 37,300 house building starts in England in Q4 2025 — a 23% improvement quarter-on-quarter and 24% improvement year-on-year, with MHCLG noting that “the higher number of starts is in part due to reforms at the Building Safety Regulator” (House of Commons Library, 2026).
But the recovery starts from a depressed base. London new build starts hit just 11,700 in Q3 2024 — a 65% decrease from the 2014 peak (Property Notify, 2026). Planning-to-start timelines have stretched to 25.7 months on average in London (Property Reporter).
The structural implication: housing supply is meaningfully behind underlying demand, and the gap is unlikely to close in a 2026 investor’s typical holding horizon. Operators who can deliver new housing supply — including through commercial-to-residential conversion — sit on structurally favourable demand dynamics.
Shift 3: Regional outperformance has become structural, not cyclical
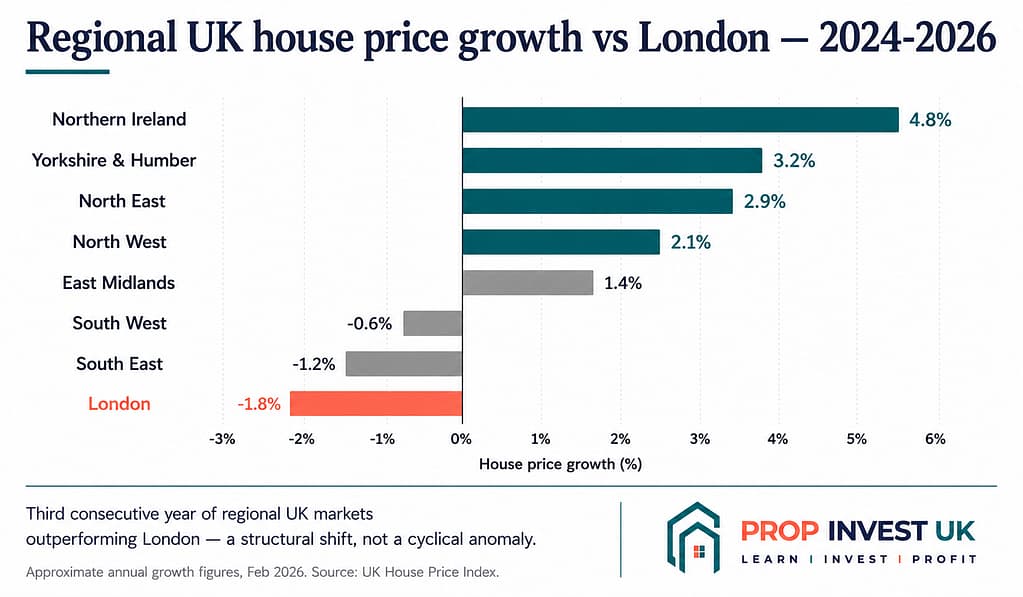
The pattern of regional UK markets outperforming London is now in its third consecutive year. Yorkshire & Humber, the North East, and Northern Ireland are leading the country in house price growth. The North West (centred on Manchester) and the Midlands (Birmingham and Leeds) are seeing strong rental demand pressure.
This isn’t a cyclical anomaly waiting to revert. The structural drivers are:
- Affordability differentials — London is roughly 14× average UK earnings; major regional cities sit at 5-7×. The affordability ceiling in London limits further growth
- Hybrid working — the work-from-anywhere shift has reduced the absolute requirement to be in London for many professional jobs
- Regeneration investment — major regional cities have benefitted from substantial regeneration spending (Manchester’s MediaCity, Birmingham’s HS2-adjacent investment, Leeds’ city centre redevelopment)
- University demand — UK universities outside London continue to draw substantial student populations, driving regional HMO and PBSA demand
For UK property capital, the regional outperformance has direct implications. Capital that defaulted to London allocation through the 2010s is increasingly looking at regional opportunities — particularly in cities where regeneration is active and supply remains constrained.
Shift 4: The student accommodation supply gap
Industry reports suggest the UK could face a shortage of more than 500,000 student beds by 2026, particularly in major university cities (dbrinvest, 2026). Purpose-built student accommodation (PBSA) and high-quality professional HMOs sit at the centre of this supply gap.
PBSA gross yields of 6-8% are achievable in strong university markets — substantially above the standard BTL yield range of 4.5-5.5%. The structural drivers — UK higher education attracting hundreds of thousands of domestic and international students annually, combined with limited supply and tight rental conditions — support sustained yield premium.
For operators capable of delivering HMO conversions in the right markets (which we covered in our Gore Terrace case study and Mozarts conversion article), the demand-supply dynamics support strong yields and stable rental income through the 2026-2030 period.
Shift 5: Capital is moving from passive ownership to active development
The final structural shift is at the capital allocation level. UK property capital is moving from passive landlord ownership to active development, from generalist allocation to specialist operators, and from direct property ownership to capital partnership structures.
The reasons are partly the Section 24/EPC/Renters’ Rights regulatory squeeze on individual BTL ownership, and partly the recognition that operator-driven returns through development are decoupled from the natural market direction in ways that BTL returns are not.
The Build-to-Rent (BTR) sector saw substantial institutional capital flow through 2025, though Cushman & Wakefield notes that “viability issues have and will continue to impact the level of new supply coming forward” — meaning the BTR pipeline is constrained even with institutional appetite.
At the private investor scale, capital is moving into:
- Development capital partnership (lending to developers as we covered in our investor security and fixed return vs equity articles)
- HMO development specifically (yield premium over standard BTL)
- Commercial-to-residential conversion (forced appreciation through planning)
- Pension-structured property investment (SSAS and SIPP, which we covered in our SSAS and SIPP articles)
The investor profile shifting toward these structures isn’t speculative — it’s typically experienced BTL investors who understand property economics but no longer want to be active landlords in the 2026 regulatory environment.
Where serious capital is actually moving in 2026
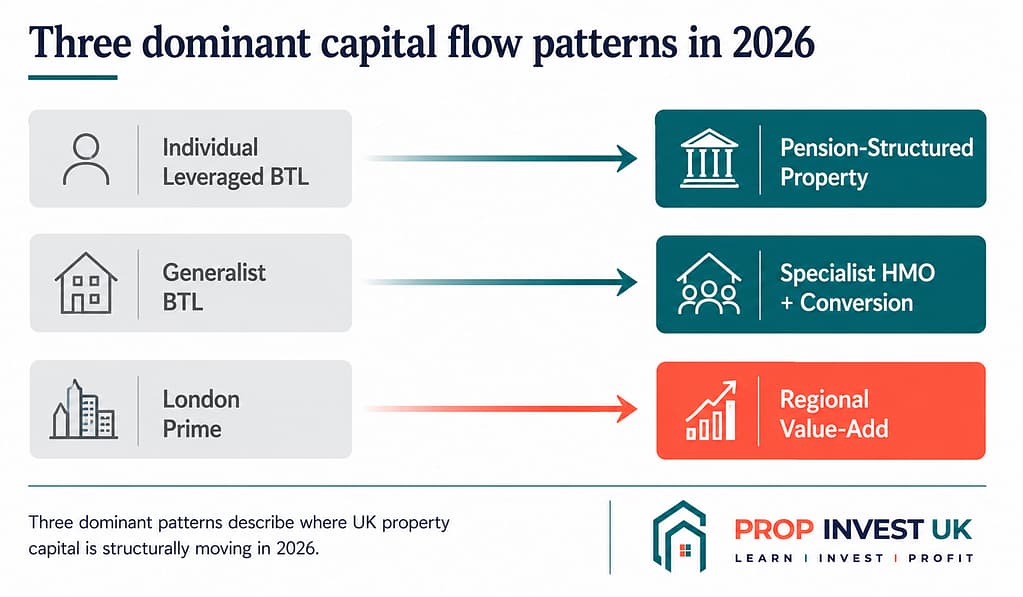
If you map the capital flows across the UK property investment landscape, three patterns dominate.
Pattern 1: Out of individual leveraged BTL, into pension-structured property
Individual landlords with leveraged BTL portfolios are increasingly exiting (or considering exiting) the model. The capital is moving in three directions:
- Into pension structures (SSAS, SIPP) for tax-efficient property exposure
- Into limited company BTL portfolios (restoring mortgage interest deduction at the cost of incorporation friction)
- Out of property entirely (gilts, equities, alternatives, lifestyle spending)
The pension-structured route preserves UK property exposure while addressing the Section 24 tax burden. For investors with significant pension capital, this is structurally the most coherent reallocation route.
Pattern 2: Out of generalist BTL, into specialist HMO and conversion
Investors who want continued direct property ownership are increasingly moving from generic BTL into specialist segments where yields and forced appreciation potential are higher. HMOs in university or professional rental markets. Commercial-to-residential conversions. Purpose-built student accommodation where capital partnership structures allow participation.
The common thread: specialist segments produce higher returns than generic BTL, but require operator capability that most individual investors don’t have. The structural answer for these investors is capital partnership with operators who do have the capability — evidenced across our investor content through the case studies at Gore Terrace, Mozarts, and the Windsor Lodge.
Pattern 3: From London to regional, from prime to value-add
UK property capital is moving from London prime allocation toward regional value-add opportunities. The structural drivers:
- London prime offers limited yield (sub-3%) and limited capital appreciation under current conditions
- Regional value-add (HMO conversions, commercial-to-residential, regeneration-adjacent developments) offers 6-9% yields and substantial forced appreciation potential
- Operator quality matters more in regional value-add than in London prime, but for investors willing to do operator due diligence (which we covered in our vetting article), the returns differential is substantial
This regional value-add positioning is central to how we operate. South Wales, the South West, and other regional markets where forced appreciation through planning and conversion is consistently achievable form the geographic backbone of our project pipeline.
The strategic implications for 2026 capital allocation
For a UK property investor evaluating where to deploy capital in 2026, four practical implications flow from the landscape above.
Implication 1: Natural appreciation alone won’t produce strong returns
The Savills 5-year forecast of +24.5% UK house price growth equates to roughly +4.5% annual compound growth. For a leveraged investor under Section 24, this barely covers borrowing costs and tax burden, leaving little net return. For an unleveraged investor, +4.5% per annum is significantly below historical UK property returns and below current gilt yields.
Capital deployed into pure natural-appreciation strategies (passive BTL, completed-asset holding) is structurally constrained in the current cycle. The investors who do well in 2026 are those who can access forced appreciation mechanisms — typically through capital partnership with capable development operators.
Implication 2: Regional matters more than London
For the first sustained period in two decades, UK regional markets are outperforming London. This isn’t a cyclical anomaly — it’s a structural shift driven by affordability, hybrid working, regeneration investment, and demographic change.
Capital defaulting to London allocation through the 2010s should be evaluating the regional opportunity set in 2026. The yield premium, the forced appreciation potential, and the operator quality differential all point in the same direction.
Implication 3: Operator quality is the decisive factor
In a market where natural appreciation is muted and structural complexity is high, the difference between operators is the difference between strong returns and disappointing ones. We covered this in our forced appreciation article — when returns depend on operator skill rather than market direction, operator selection becomes the most important investor decision.
The seven-category vetting framework in our operator vetting article applies to every capital partnership decision. The investors who succeed in 2026 will be those who selected operators with documented track records, real case study evidence, and consistent structural disciplines across multiple completed projects.
Implication 4: Pension structure choice is increasingly decisive
For investors with significant pension capital, the tax efficiency of pension-structured property investment is increasingly material. SSAS-held capital lending to property developers, SIPP-held commercial property, and pension-structured arrangements generally produce after-tax returns that can be substantially higher than individual leveraged BTL ownership.
The structural decision — whether to use a SSAS, SIPP, or remain outside the pension wrapper — is becoming one of the most consequential allocation choices in UK property investment. The 2027 IHT change adds urgency to this decision for investors planning legacy positions.
The four-question 2026 capital allocation framework
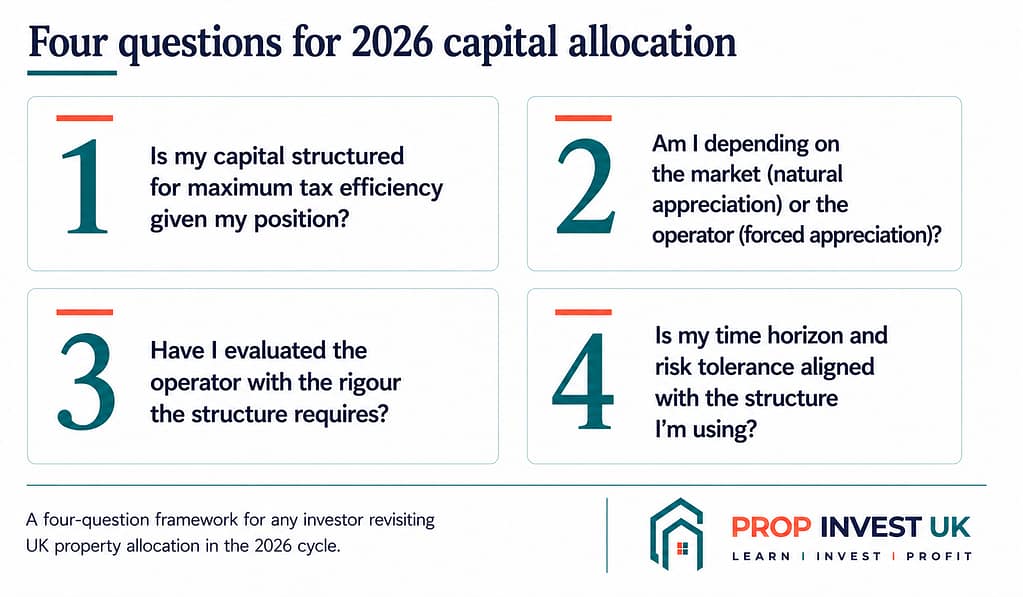
For investors revisiting their UK property allocation in 2026, four questions are worth working through systematically.
1. Is my capital structured for maximum tax efficiency given my position?
For most investors with significant pension capital, the answer involves some form of pension-structured property exposure — SSAS, SIPP, or capital partnership returns flowing into existing pension wrappers. We covered the technical detail in our SSAS and SIPP articles.
For investors without significant pension capital, the structural options include limited company BTL portfolios, family investment companies, and capital partnership structures where the returns are interest income rather than rental income.
2. Am I depending on the market (natural appreciation) or the operator (forced appreciation)?
Strategies depending on natural appreciation alone face muted 2026-2029 returns. Strategies depending on operator-driven forced appreciation can produce substantially higher returns regardless of market direction — but only when the operator has the capability to deliver.
3. Have I evaluated the operator with the rigour the structure requires?
In capital partnership structures, the operator’s quality determines the investor’s outcome. The seven-category vetting framework (Companies House → track record → financials → references → friction handling → deal structure → personal credibility) is the minimum due diligence standard.
4. Is my time horizon and risk tolerance aligned with the structure I’m using?
Direct BTL ownership is effectively a 10+ year hold for tax efficiency reasons. Capital partnership in development is typically 18-30 months per project, then redeployable. Pension-structured property is typically multi-decade. Match the structure to the horizon, not the other way around.
How we position for the 2026 landscape
Our operating model is structurally aligned with the 2026 landscape in several specific ways.
Regional UK focus — projects concentrated in South Wales, the South West, and other regional UK markets that benefit from the regional outperformance shift. The operational depth in these markets (contractor relationships, planning knowledge, off-market deal sourcing) is what allows forced appreciation through planning gain and conversion at the scale evidenced by Gore Terrace and Mozarts.
Commercial-to-residential conversion specialisation — directly aligned with the structural housing supply shortage and the residential demand persistence forecast through 2030. Our planning capability in Article 4 and conservation areas allows access to deal flow that generalist developers can’t deliver.
Capital partnership structures suited to investor capital flowing from BTL exits and pension allocation — second legal charges, professional documentation, fixed-return and equity participation options, deal-by-deal structuring matched to investor circumstances. Documented across the case studies of Raf at Gore Terrace, Jason at the Windsor Lodge, and Glenn at Mozarts.
Operator transparency as competitive moat — the body of investor content (foundational education, case studies, market commentary) is itself the differentiator in a 2026 landscape where operator selection is the decisive investor factor. Investors evaluating us have access to more substantive content than is available for most UK property operators in the same market segment.
In summary
The UK property investor landscape in 2026 is structurally different from the one that prevailed through the 2010s. The Bank of England has cut rates to 3.75% but borrowing costs remain materially elevated. UK house prices are growing modestly (+1.2% YoY) with sustained regional outperformance over London. Landlords are exiting BTL under regulatory pressure. Construction starts are recovering from a depressed base but planning timelines remain long. Rental yields and HMO/PBSA demand are supported by structural supply shortages.
For UK property investors, the strategic implications are:
- Natural appreciation alone won’t produce strong returns — capital deployed into passive BTL or completed-asset holding faces muted 2026-2029 outcomes
- Regional matters more than London — the structural outperformance is in its third consecutive year and shows no sign of reversing
- Operator quality is the decisive factor — in capital partnership and development strategies, operator selection determines outcomes
- Pension structure choice is increasingly material — SSAS and SIPP-structured property exposure produce categorically better after-tax returns than individual leveraged BTL ownership for many investor profiles
The four-question framework: tax structure efficiency, market vs operator dependency, operator vetting rigour, and time horizon alignment. Applied systematically, these questions surface the structural reallocation choices most UK property investors should be making in the current cycle.
The capital that does well in 2026 isn’t the capital that’s most aggressive. It’s the capital that’s most strategically positioned — through the right structures, with the right operators, in the right segments, for the right time horizons.
If you want to discuss how the 2026 landscape might shape your specific allocation decision — and whether our capital partnership might fit your circumstances — you can join the Prop Invest UK investor list. We share specific opportunities with capital partners and welcome the structural due diligence approach described across our content.
This article is general information only and is not financial advice. UK property markets, tax law, and regulatory frameworks change over time. Investors should take independent professional advice on their specific circumstances. Development carries risk; capital is at risk. Past project outcomes are not indicative of future performance. Market forecasts referenced are from external sources and reflect their views at time of publication.