
Introduction
Most property investors are trained to look at purchase price first.
It’s the headline number on every buy-to-let listing, every auction lot, every property portal. The figure that anchors every conversation: what did you pay for it.
In property development, purchase price is one of the least useful numbers on the page.
The number that determines everything — whether a project is viable, whether a lender will fund it, what an investor’s position looks like at the end, and whether there’s enough margin for the project to survive the inevitable friction — is Gross Development Value (GDV).
This guide explains what GDV is, how it’s calculated, why experienced investors look at it before any other number on a development opportunity, and how to read a GDV figure critically when one is presented to you.
It’s written for investors evaluating UK property development opportunities — particularly those moving from buy-to-let or completed-asset investing into participating in development projects as capital partners.
What GDV in Property is, in plain terms
Gross Development Value is the total market value of a development project once the work is finished and the units are sold.
It is a forecast. Not what the site is worth today. Not what was paid for it. What it will be worth, on the open market, once the project is complete.
For a residential scheme, GDV is the combined sale price of every finished unit. For a commercial scheme, it’s the investment value calculated by capitalising the expected rental income. For a mixed-use scheme — flats above ground-floor commercial space, for example — it’s both added together.
That single figure drives:
- How much a lender will lend against the project
- Whether the scheme is financially viable at all
- Where the developer’s profit comes from
- What protection investors have if conditions move
GDV is the forecast the entire project sits on. Every other number on a development appraisal is calibrated to it.
Why GDV matters more than purchase price

Buy-to-let investing and development investing are not the same business. They share an asset class — property — but the economics, the time horizon, and the way value is created are different. The number you look at first should reflect that.
In buy-to-let, purchase price is the anchor
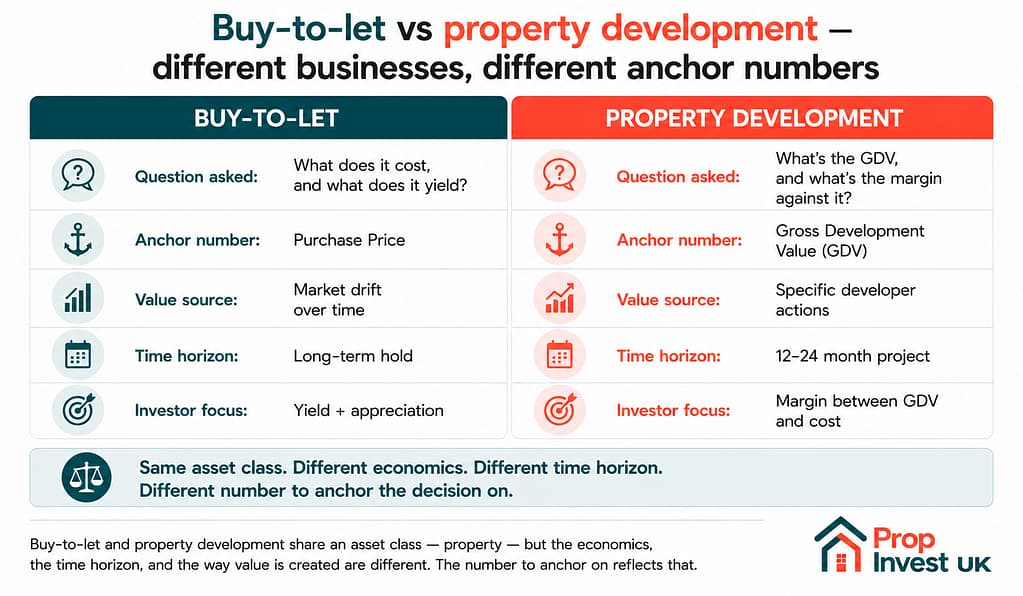
When you buy a completed buy-to-let, the question is straightforward: what does it cost, and what does it yield. You pay £250,000, the property is worth £250,000, you collect rent, and you wait for the asset to appreciate over time. The purchase price is what determines your return, because the property’s value at the moment you buy it is, broadly, what it will continue to be worth — give or take market drift.
In development, the gap between purchase and GDV is the entire business
Development works the opposite way round.
The site we acquire is the raw input. Its current value is largely irrelevant. What matters is the gap between what we pay and what the finished project will be worth on completion.
A worked example illustrates this most clearly.
Consider an awkward commercial building — a vacant office or retail unit on a residential street — that’s been sitting empty for years. Its market value as-is might be £400,000.
That same building, once planning consent has been secured for conversion into six flats, might suddenly be worth £550,000. No physical work has been done. Not a brick has been laid. The increase in value comes entirely from the change in permitted use — the legal right to do something more valuable with the building.
Once the conversion is completed and the six flats are sold at £200,000 each, the GDV is £1.2 million.
Same building. Three different values.
| Stage | Value | What changed |
|---|---|---|
| As-is commercial | £400,000 | Nothing — current state |
| With planning consent | £550,000 | Permitted use upgraded |
| Completed scheme (GDV) | £1,200,000 | Conversion delivered, units sellable |
The journey from £400,000 to £1.2 million — minus everything it takes to bridge that gap — is the project. That gap is where the developer’s margin and the investor’s return live.
If you judge that opportunity by the £400,000 purchase price, the deal looks expensive for a tired building no one else wants. If you judge it by the £1.2 million GDV and the structure of the gap between them, the deal makes sense.
This is why “how much did you pay for it” is one of the least informative questions an investor can ask a developer about a project. The more useful question is: what is the projected GDV, what comparables is it built on, and what margin does the project show against it.
The five mechanisms that create GDV
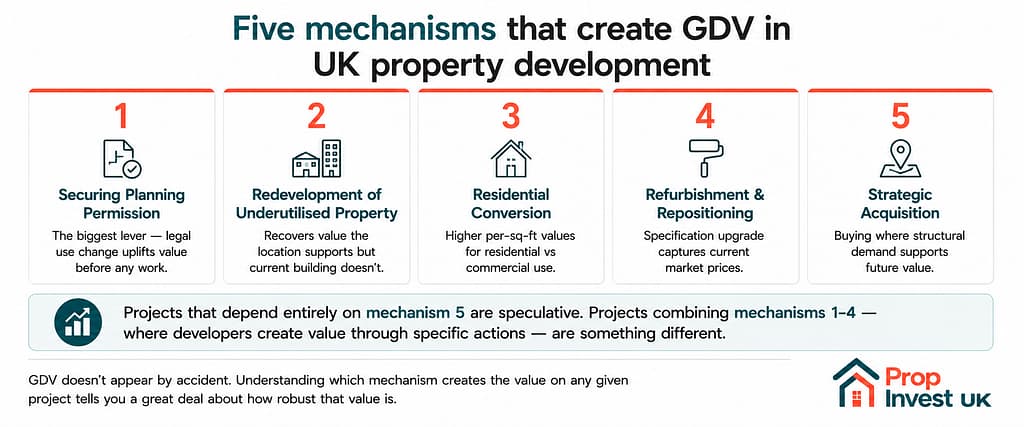
GDV doesn’t appear by accident, and it doesn’t come from market drift. It’s the result of specific, repeatable strategies a developer applies to a site. Understanding which mechanism is creating the value on any given project tells you a great deal about how robust that value is.
The five core mechanisms:
1. Securing planning permission
The single biggest lever in UK property development. Planning consent converts a building or site with one permitted use into a building or site with a more valuable use — and that change can produce a significant uplift in value before any physical work begins.
A commercial unit consented for conversion to residential typically shifts into a higher per-square-foot value bracket. A field with consent for housing is worth multiples of a field without it. The uplift exists because planning consent removes the largest single source of project risk: whether the use change is permitted at all.
2. Redevelopment of underutilised property
Some buildings underperform their location. A poorly configured 1970s office block on a high-value residential street. A tired industrial unit in an area that’s gentrified around it. Redevelopment — substantially altering or rebuilding to a higher specification — recovers the value the location supports but the current building doesn’t deliver.
3. Residential conversion
A specific case of the first two: converting commercial, industrial, or office space into residential units. Demand for residential typically commands higher per-square-foot values than the original use, particularly in areas with strong residential demand and constrained supply.
4. Refurbishment and asset repositioning
Upgrading the specification, configuration, or market position of an existing asset to compete in a higher price bracket. A dated property refurbished to current market expectations sells at a current market price, not the depressed price it was bought at.
5. Strategic acquisition in areas with structural demand
Buying in locations where market dynamics — infrastructure investment, planning policy shifts, demographic trends — are expected to support value over the project’s lifetime. The least controllable of the five mechanisms, and therefore the one experienced developers rely on least heavily.
A properly structured development project should have a clear answer to the question: which of these mechanisms is creating the value, and how confident are we in each one. Projects that depend entirely on mechanism five — buying into rising markets — are speculative. Projects that combine the first four, where the developer is creating value through specific actions, are something different.
How GDV is calculated
GDV is not a number a developer invents. A credible GDV is built from comparable evidence — recent sales of genuinely similar properties in the same area — and then stress-tested before it becomes the basis for any financial decision.
Residential GDV: the standard method
For residential schemes, GDV is calculated in four steps:
- Calculate the total saleable area of the finished scheme. Every flat, house, or unit added together, measured by gross internal area for houses or net internal area for flats.
- Research current per-square-foot values from comparable new-build sales in the immediate area. The comparables must be genuinely comparable — typically new-build sales within 0.5 miles of the site, completed within the last 6–12 months, of similar specification and target market.
- Apply the per-square-foot rate to each unit type in the proposed scheme. If comparable new-builds in the area sell at £350 per square foot and the proposed units average 850 square feet, each unit is valued at approximately £297,500.
- Add additional revenue streams — parking spaces, storage, any ground-floor commercial element, service charge income.
The quality of any GDV calculation lives or dies on the comparables. A new-build flat in a converted period commercial building is not comparable to a 1990s ex-council flat round the corner, even if they’re the same size. Specification, target buyer, and position in the local market all need to align. A weak comparable produces a weak GDV.
Commercial GDV: the investment method
For commercial schemes, the approach is different. Commercial property is typically valued on the yield it produces, not on per-square-foot sale prices.
The method:
- Estimate the annual rental income the completed asset will generate at current market rents
- Capitalise that income at the appropriate market yield for the asset type and location
A worked example: if a completed commercial unit will generate £120,000 of annual rent, and the market yield for that asset type in that location is 6%, the GDV is £120,000 ÷ 0.06 = £2 million.
The two variables that matter here are the achievable rent and the yield. Both must be evidenced from actual recent transactions, not assumed from headline market commentary.
Mixed-use schemes
For schemes combining residential and commercial — typical for many UK conversion and redevelopment projects — GDV is the sum of the residential element (calculated by the comparable sales method) and the commercial element (calculated by the investment method).
The independent valuation
A developer’s internal GDV calculation is the starting point — but it isn’t the figure that ultimately matters for financing.
When a project goes to a development finance lender, the lender instructs an independent RICS-qualified surveyor to produce their own GDV. Crucially, that surveyor is instructed by the lender, not by the developer. Their figure — not the developer’s — is what determines how much the lender will advance.
This matters for investors because it means there’s an external check on any GDV being presented. A developer whose internal GDV consistently aligns with independent valuations has a calibrated view of the market. A developer whose figures come in materially above independent valuations doesn’t.
How to read a GDV figure critically
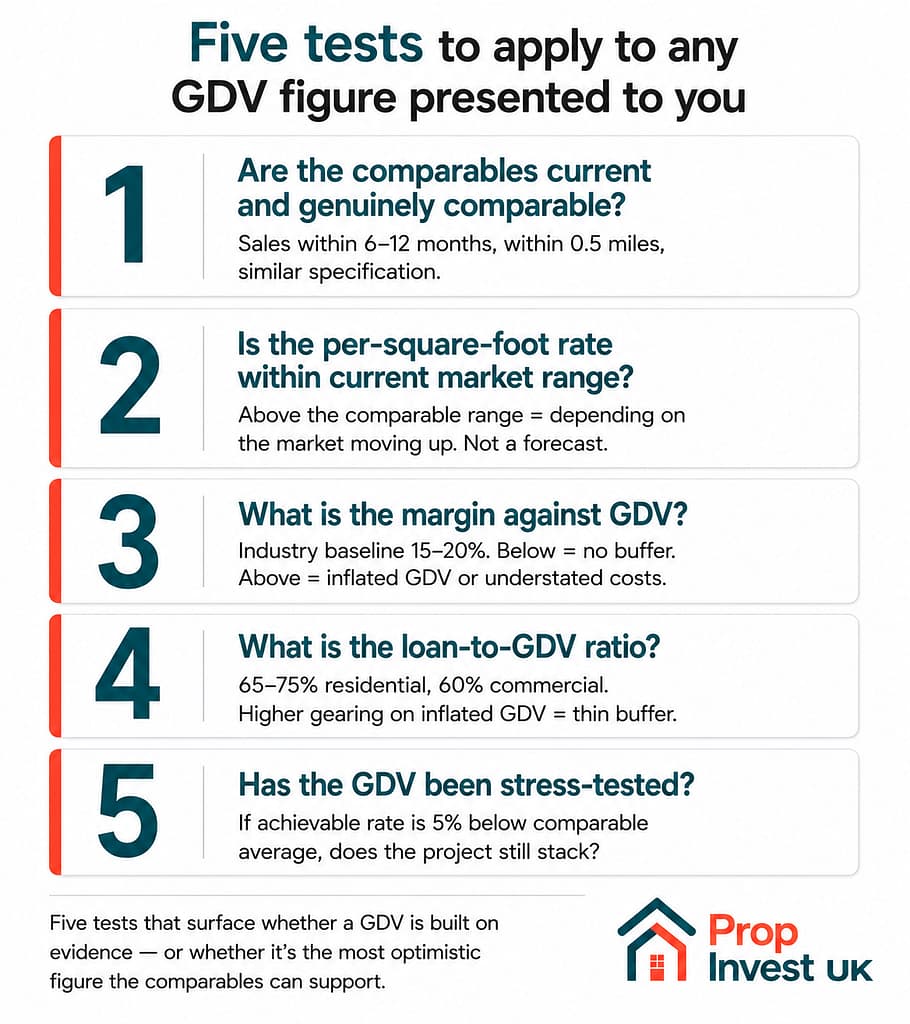
Knowing that GDV is the most important number on a development appraisal is one thing. Being able to evaluate the GDV someone has put in front of you is another. There are five tests worth applying to any GDV figure presented in an opportunity.
Test 1: Are the comparables current and genuinely comparable?
The strongest GDVs are built on sales completed within the last 6–12 months, within 0.5 miles of the site, of similar specification and target market. The weakest GDVs are built on older comparables, comparables from different micro-markets, or comparables of dissimilar specification.
A developer should be able to tell you the specific comparables behind a GDV — addresses, sale prices, completion dates, square footage. If they can’t, the GDV hasn’t been built from evidence.
Test 2: Is the per-square-foot rate within current market range?
Once you have the comparables, the per-square-foot rate applied to the scheme should sit within the actual range of those comparables — not above it. A GDV that requires per-square-foot values above anything currently being achieved in the area is a GDV that depends on the market moving up. That’s not a forecast; it’s a hope.
Test 3: What is the margin against GDV?
The development margin — the gap between GDV and total project costs — tells you whether the project has room to absorb friction.
According to industry data, UK developers typically target a profit margin of around 20% of GDV, with 15–20% being more realistic in the current market given rising construction and finance costs (Funding Guru, 2026).
A project showing materially below that range — say, 8–10% margin against GDV — has no buffer. Any cost overrun, planning delay, or weakening of sale prices eats directly into investor returns. A project showing materially above that range — say, 30%+ — usually means either the GDV is inflated, the costs are understated, or both.
The 15–20% range isn’t a target to celebrate; it’s a baseline to defend against.
Test 4: What is the loan-to-GDV ratio?
Development finance lenders typically lend up to 65–75% of GDV on residential schemes, and up to 60% on commercial. That gearing structure exists because lenders need a buffer between the loan amount and the finished value.
If a developer is funded at the high end of those ranges and the GDV is also at the high end of plausible, the buffer is thin. If they’re funded conservatively against a realistic GDV, the project has room to move.
Test 5: Has the GDV been stress-tested?
The GDV that anchors a project should not be the most optimistic figure the comparables support. It should be a figure the project can survive a downward move from.
A useful question to ask: if the achievable per-square-foot rate at completion is 5% below the current comparable average, does the project still stack. Developers who’ve done this exercise have a clear answer. Those who haven’t, don’t.
Why GDV matters more in 2026 than in previous years
Two structural shifts in the UK market make GDV discipline more important now than at almost any point in the last decade.
Construction costs have not reverted
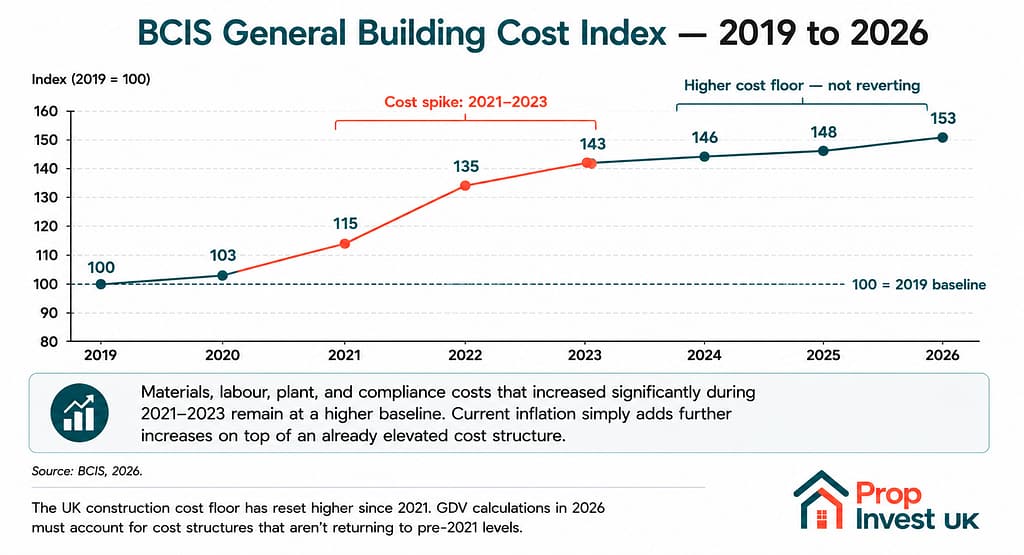
The cost spikes of 2021–2023 are not fully behind the industry. The BCIS General Building Cost Index, which combines labour, plant and materials costs, recorded annual inflation of 3.8% in March 2026 (BCIS, 2026). Construction material prices remain 29–43% above 2019 levels (JLL, 2026).
A new three-year agreement sets out further electrician wage hikes of approximately 3.95% in 2026, 4.6% in 2027, and around 4.85% in 2028 (Julian Hobbs & Co, 2026). Specialist trades are still demanding and securing double-digit uplifts in some categories.
The implication for GDV: the cost side of any development appraisal is moving against the developer, which means the margin against GDV needs to be more robust, not less. Projects that worked at 2019 cost assumptions don’t necessarily work at 2026 cost realities.
Financing conditions remain restrictive
UK inflation falling to 3% in January 2026 has increased expectations that the Bank of England may begin reducing interest rates during 2026, but rates remain well above the levels that prevailed in the previous decade (Construction Magazine, 2026).
For development projects, this affects both the cost of development finance and the demand-side market the finished units sell into. Higher borrowing costs reduce net profit for developers, especially for projects funded with development finance (Funding Guru, 2026). They also slow the absorption rate of completed units, extending the period between practical completion and final sale.
The implication: the timeline assumptions baked into a GDV calculation matter as much as the figure itself. A robust GDV in 2026 accounts for slower sales velocity than the same project would have assumed in 2019 or 2020.
The structural cost floor
The construction sector is moving into a period of cost stabilisation rather than cost reduction. Materials, labour, plant, and compliance costs that increased significantly during 2021–2023 remain at a higher baseline, and current inflation simply adds further increases on top of an already elevated cost structure (Construction Magazine, 2026).
In practical terms, a GDV stress test in 2026 should assume costs do not fall meaningfully from current levels. Sales prices may not rise meaningfully either. Projects need to stack on the numbers visible today — not on hoped-for future conditions.
What this means for how we appraise projects
At Prop Invest UK, GDV is the starting point of every project we evaluate — not the finishing point.
Before we commit to acquiring a site, we build the GDV from comparable evidence, stress-test it against conservative assumptions, and only proceed where the margin against GDV is robust enough to absorb the kinds of friction every development project encounters: planning timelines that run longer than expected, build cost movement during the construction period, slower-than-modelled absorption during the sales window.
For every project we present to capital partners, the documentation includes:
- The projected GDV, with the specific comparables it is built on
- The total development cost breakdown — acquisition, build, professional fees, finance, contingency
- The margin against GDV and how that margin is structured between developer profit and investor return
- The loan-to-GDV ratio of any development finance facility
- The stress-test scenarios — what happens to investor returns if costs move up 5%, if sales prices come in 5% below current comparables, if the project runs 3 months longer than the base case
That transparency exists because investor decisions on development opportunities should be made on evidence, not narrative. The three questions every investor should ask of any development opportunity — what is the projected GDV, what comparables is it built on, and what margin does the project show against it — are the questions we expect to answer in detail before any capital conversation.
In summary
Purchase price tells you what the developer paid for the input. GDV tells you what the finished project will be worth on the open market. The gap between those two numbers — minus everything it takes to bridge them — is what development as an activity actually is.
For investors evaluating development opportunities, GDV is the single most informative number on the page. It tells you whether the project is real, whether the margin is genuine, whether the buffer is sufficient, and how the developer thinks about evidence. A credible GDV, backed by current comparables and stress-tested against realistic downside scenarios, is the foundation of any opportunity worth participating in. A weak or hand-waved GDV is the first warning sign that the rest of the appraisal won’t bear scrutiny either.
When you’re looking at a development opportunity, the first questions are now clear:
- What is the projected GDV?
- What specific comparables is it built on?
- What margin does the project show against that GDV?
- What is the loan-to-GDV ratio?
- How has the GDV been stress-tested?
A developer who can answer those five with evidence is operating on the right side of the discipline. One who can’t, isn’t.
If you want to receive analysis of current UK development opportunities — including the GDV structure, comparables, and margin profile of specific projects — you can join the Prop Invest UK investor list. We share specific opportunities with capital partners on the list as they come to market.
Suggested visuals
This article is general information only and is not financial advice. UK property development carries risk; capital is at risk. Projected GDV figures referenced in case study material reflect specific projects at specific stages and are not indicative of returns on any future opportunity. All development opportunities should be evaluated with appropriate professional advice including independent legal and valuation review.